General information
The Real-Time Geo-Spatial Consensus System (RT-GSCS) is an innovative platform useful for spatial decision-making contexts. RT-GSCS was developed by Yuri Calleo (Founder) in 2023, with the support of Francesco Pilla (Co-founder) and Simone Di Zio (Co-founder) with the aim of providing users with an efficient tool for planning their decisions based on a fundamental feature: participation. Participation in decision-making is an extremely important aspect in many individual and collective contexts that can be applied to different scenarios. RT-GSCS utilises innovative tools and a statistical algorithm of the Spatial Delphi and Real-Time Spatial Delphi to achieve a convergence of opinions among participants, enriching the product with various tools useful for the process.
Real-Time Geo-Spatial Consensus System is an easy-to-use and intuitive Spatial Support System, useful for creating and managing spatial surveys for various application contexts. What sets it apart from other systems is its user-friendly interface, making it easily accessible for many users with different types of expertise. The main feature of the platform is the incorporation of Real-Time Spatial Delphi logic, which involves iteration, anonymous consultation, and feedback from experts in a real-time interface, enriched with innovative technological tools and spatial and textual analysis.
Our platform is ideal for complex decisions as it leverages the logic of the Delphi method in a geographic version, specifically the Spatial Delphi and Real-Time Spatial Delphi algorithms.
Starting from the assumption that the convergence of opinions can also be achieved in a spatial context, Spatial Delphi is a decision-making and forecasting method that combines experts’ judgments to reach a consensus on specific issues within a geographic region or spatial system. It involves a series of rounds of anonymous survey questionnaires to gather and synthesize experts’ opinions.
Real-Time Spatial Delphi (RTSD) is a variation of the Spatial Delphi method integrated into a real-time platform, allowing experts to review and update their judgments in real-time, thereby achieving consensus on specific territories. This approach provides a more dynamic and flexible decision-making process.
The Real-Time Geo-Spatial Consensus System is generally suited for administering spatial surveys that emphasize users cooperation to achieve consensus on a specific issue.
Specifically, it can be applied in the following disciplines (but not limited to):
- Decision-making process
- Future Studies
- Society and territory
- Criminology and security
- Engineering
- Transports
- Economy
- Environment
- Climate change
In the Future Studies (FS) context, the development of future scenarios can occur in various ways, but one of the most commonly used approaches is the combination of the Delphi and the scenario method, resulting in the development of Delphi-based Scenarios. Starting from that, we have incorporated this traditional method into a real-time platform, making it particularly useful for geographical and territorial contexts. With RT-GSCS, it is possible to develop spatial future scenarios by utilizing both statistical algorithms and expert judgments.
The platform has been carefully designed to meet graphic standards while not sacrificing ease of use. The survey interface is planned to be “user-friendly” and has a geographic map as its main element, allowing experts to respond by placing one or more points, comments, and other information, creating an active engagement to achieve a convergence of opinions.

The platform provides a spatial survey with various available tools. The administrators will be enabled to create their own survey by inserting a study description and multiple questions to which users can respond by placing points on the geographic map. The algorithm will automatically calculate a circle for each point, indicating the consensus radius among participants, who can comment on their own responses or those of others at any time. Additionally, it is possible to insert multiple descriptive points on the map or draw defined areas with polygons. Furthermore, different spatial analysis in real-time are implemented including a heat-map analysis and a clustering of the points. All results are captured in the backend and easily downloadable by the administrator.
To create your survey, please contact us at support@rtgscs.com and we will respond you as soon as possible!
At the moment, you can create one survey per enabled email. Contact us at: support@rtgscs.com!
Admin section
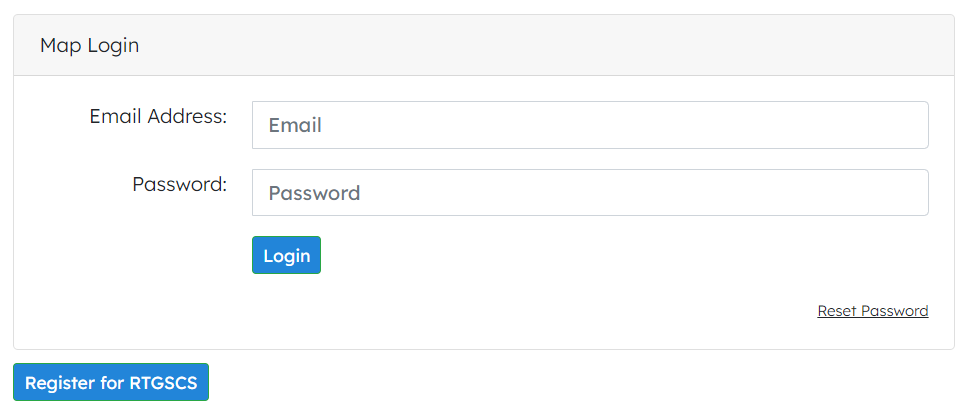
If you want to create your survey, please contact us at support@rtgscs.com and in few days we will enable your email address. Once enabled, you will receive the registration information via email and be able to access the survey by entering your credentials.
Only for the first access you will be asked to provide a name for your survey, enter it and press “Create”.
On the “LogIn” page, select: “Reset password”, and you will receive an automatic email to reset your password as soon as possible!

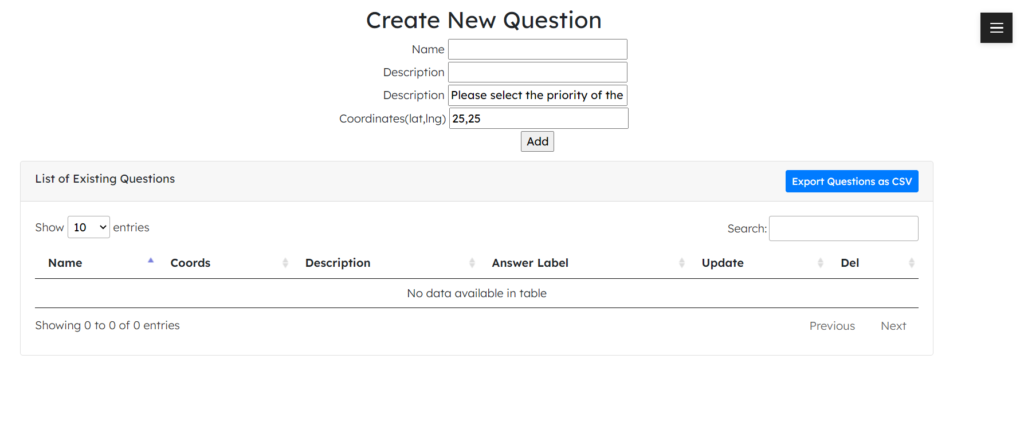
To add one or more questions, you can use the control panel on the right, click on “List of Questions”, and enter the question under the “Name” field, the identified description and the geographic coordinates of the question (e.g., if the question pertains to a particular geographic area).
You can also add the description that you want to show when a user enters a point (e.g., Please select the priority of the choice from 1-5) in order to weigh it.

To update or delete the question, refer to the list of questions, edit the name, description, and coordinates, and click “update” or “delete”* directly the question.
*If you delete a question, you will lose all the results.
The results are visible from the control panel, by clicking on the black button with the three white lines, and include both spatial and temporal data, as well as non-spatial data such as user information.
All the results can be exported in CSV format by clicking on the “Export as CSV” button in each section of the control panel.

All users’ comments on the submitted points can be viewed and exported using the “comments” section in the control panel.
Certainly! By clicking on the “Update Documents/Attachments” item in the control panel.
Once you have completed the survey creation process, you can invite users to respond to your questions! From the map interface, click on “Share” (bottom right) and share the link with whomever you prefer! Please note that each user will need to provide a valid email address that will need to be approved by you to use the platform.

Approving participants is very simple! From the control panel, click on “Approve/Reject Viewers” and you will see a list of people waiting to be approved or removed. During the survey, you can temporarily disable or delete users at any time.
Users section
To access the survey and start answering the questions, you will need to receive a valid link from the survey admin. Once you have received the link, you can enter your email address in the designated section and wait for approval.
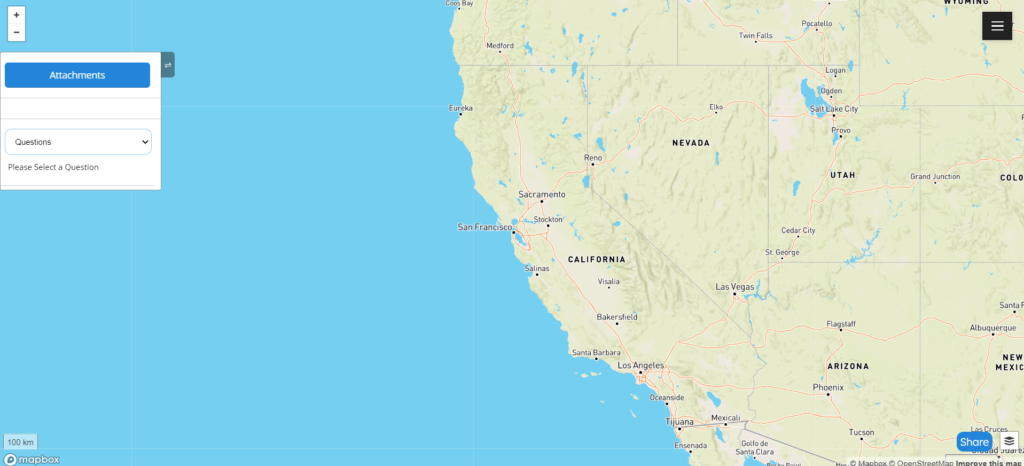
To respond to a question, navigate to the left-hand box and click on the scrollable “Questions” window. Choose the preferred question from the list, and the interface will redirect you to the corresponding geographic area. Here, you can input one or multiple points. By adding a point on the map, you will be prompted to assign a weight ranging from 1 to 5, reflecting your judgment based on the research objectives. After selecting the weight, click on “Submit” to proceed.
You have the option to enter three types of points: “Geo-consensus points,” which are useful for the final consensus. “Descriptive points,” which are helpful for providing general information but not for the final consensus. “Polygons,” where you can draw areas on the map to provide selected information about a specific region.
To provide comments on your own point or the points placed by other users, simply click on the respective reference point. In the left-hand panel, you can see existing comments from others and add your own by clicking “Submit.”
When a point is placed outside the consensus area, an automatic window will appear, asking you to provide a reason for your decision. At this point, you can optionally provide a justification and click “Submit.”
To switch between different layers (such as satellite view, outdoor view, etc.), locate the list of available layers next to the “share” button at the bottom left. Simply select the desired layer from the list.
The circle represents the achieved convergence, which indicates the area of interest identified by the experts. Consult it in real time to gain a better understanding of the decisions made by other participants!
Currently, the platform provides advanced real-time tools, such as real-time consensus visualization, which is displayed graphically with a circle on the map, as well as data representation. Additionally, it is possible to change the map view at any time, including different layers and real-time spatial analyses such as cluster analysis and heat maps.
support@rtgscs.com